Introduction
The idea behind word2vec is based on a linguistic hypothesis called the distributional hypothesis, which states that words that occur in the same or similar contexts tend to have similar meanings. This hypothesis applies to context-to-words relations, and to words-to-context. Thus, similar words should occur in similar contexts, and similar contexts should have similar words.
In NLP, the meaning of words can be represented by their embeddings – numerical vector representations in the multi-dimensional vector space. Embeddings can be ‘learnt’ from text using linear algebra techniques like Singular Value Decomposition (SVD), Non-Negative Matrix Factorization or other decompositions.
The algorithm for word2vec is an example of learning word embedding from text that allows for performing arithmetic on the learned embeddings. Here embeddings are learnt through gradient descent by training a shallow neural network. There is a ready implementation of word2vec in Python in the genism library. Apart from word2vec, one can use the Embeddings module from TensorFlow keras. Yet another approach involves using FastText – an optimization on word2vec where words’ morphology and sub-words are leveraged.
In this blog we pretend that we are data scientists at a small online retailer and develop an easy to use Excel-based tool using word2vec to help our company to do the following:
- Find products that are similar to a given product based on on-line browsing behaviour of our customers. This can be used to offer similar products for customers who call us to place an order for an item that is out of stock.
- Find products to recommend as next purchase based on on-line browsing behaviour of our customers.
The above functionality will be offered via simple functions in Excel, exposed via the xlSlim addin. Let’s get started!
The Data
The data for this blog comes from Kaggle. There are two data files available to download, and we will use the one from Oct-2019. The data contains anonymized records for the items customers viewed, added to their cart and purchased. We only use records for items that customers viewed.
Since word2vec is an NLP model, let’s make the connection between viewing items and words in sentences explicit:
In each online session of a customer, viewed items’ product ids are treated as words and the session is treated as a sentence/context.
The required data pre-processing will transform viewed item records into a lists of lists, each list being a unique customer session. It is quite simple and includes steps for:
- Keeping records for viewed items only (40,779,399 records)
- Removing records with N/A category codes (reduced to 27,542,941 records)
- Remove duplicate views of the same item on the same date by the same customer (reduced to 17,309,221 records)
- Reduce data to only records of at least two viewed items in a given day (reduced to 15,260,646 records)
The list of lists for a session-generated viewed product is the input into the genism Word2Vec model.
The Model
We use the genism implementation of Word2Vec. The model is initialised with the following parameters:
- min_count = 2, meaning the product id must appear at least twice in the corpus (i.e. in the list of lists) to be used
- vector_size = maximum length of an online session in the number of viewed items. This happens to be 1,013. This parameter determines the length of each word vector, i.e. the number of embeddings.
Note that by default, we train a CBOW architecture.
The model is trained using all data and saved as a .model object using genism built-in utilities. All model code is available on my github repository. The code blocks below shows the implementation of the methods to get similar products and recommended product:
| def get_similar_product(model:Word2Vec, df:pd.DataFrame, product_id:int)->pd.DataFrame: | |
| """ | |
| Parameters | |
| ———- | |
| model : instance of Word2Vec | |
| df : dataframe with preprocessed data | |
| product_id : int | |
| unique product id for which we need to find similar product ids | |
| Returns | |
| ——- | |
| dataframe with similar products | |
| """ | |
| try: | |
| sim_product = model.wv.most_similar(positive=[str(product_id)]) | |
| return df.loc[df['product_id'].isin([int(word[0]) | |
| for word in sim_product])][[ | |
| 'category_code', | |
| 'brand', | |
| 'product_id']].drop_duplicates() | |
| except KeyError: | |
| return f"Cannot find the specified product with id {product_id}" | |
| def recommend_next_purchase(model: Word2Vec, df:pd.DataFrame, user_id:int)->pd.DataFrame: | |
| """ | |
| Parameters | |
| ———- | |
| model : instance of Word2Vec | |
| df : dataframe with preprocessed data | |
| user_id : int | |
| unique user id for whom we make recommendations | |
| Returns | |
| ——- | |
| dataframe with recommended products | |
| """ | |
| try: | |
| # Find the products the user browsed | |
| viewed_products = df.loc[df['user_id']==user_id]['product_id'].unique() | |
| # Get recommendations for next purchase | |
| output_words = model.predict_output_word([str(product) for product in viewed_products]) | |
| return df.loc[df['product_id'].isin([int(word[0]) | |
| for word in output_words])][[ | |
| 'category_code', | |
| 'brand', | |
| 'product_id']].drop_duplicates() | |
| except KeyError: | |
| return f"Cannot find the specified user with id {user_id}" | |
It takes approximately 5 minutes to train and save the model. The idea is that we, the data scientists, pre-train our word2vec model and provide the end users with an Excel file that has a few functions. One function will let the user to get a product or a category recommendation for a user id. Another function can be used to get similar products for a product id. Note that the config file controls the model and data parameters which would otherwise be hard coded in the Python code. The path to the config file is the only hard-coded global parameter.
User Application
For the user interface we implement two functions, one to find similar products, and another to recommend either the category or products to buy next.
A simple model interface where both functions are exposed in Excel can be built using the xlSlim addin. xlSlim is very easy to use and one can set-up an Excel based tool from Python methods in minutes. Note that we can update the model with new data, but the end user would not care or know about it, as long as the interface code has access to the model object.
My github page has the Excel file, with the formulas are as shown below:

The formulas register the Python module that implements our two functions and loads the model and the data objects.
get_similar_product_from_handle()
and
recommend_next_purchase_from_handle()
are made available to Excel by xlSlim. We pass to these functions a handle to the model object, and a handle to the dataframe. It is the need to work with the handle to the dataframe that requires to use .._from_handle() versions of the exposed method.
Note that the file needs to be opened from the xlSlim application, which seamlessly loads and activates the addin.
Entering a known product_id (a child’s carriage) for a similar product gives the following output:

Entering a known user_id (a user who has viewed computer memory and video cards) for product recommendations gives the following output:

Word2Vec is a powerful model that goes beyond human language applications. Using Excel and an addin that can expose Python functionality as Excel functions (e.g. xlSlim) is a quick and easy way to build user interfaces either to be used as a proof of concept or as a permanent flexible solution. Not all companies have the IT and data engineering resources to run servers and support web-based APIs, so, Excel is definitely a viable alternative.
 and
and  , the proportional change is:
 . In contrast, absolute moves are defined simply as the difference between two historical price observations:
  .
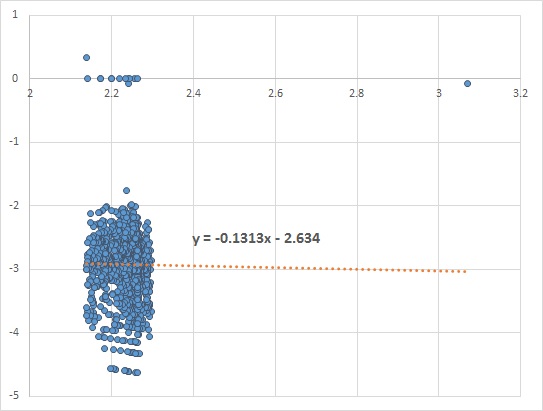
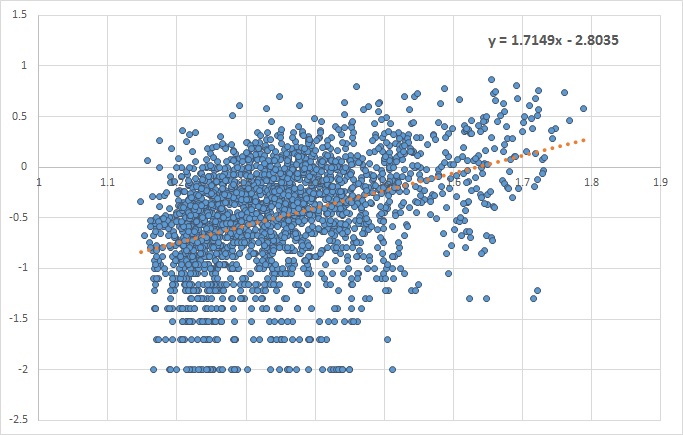
. vs.
vs.  we look for the value of the slope of the fitted linear line. A slope closer to zero indicates no dependency, while a positive or negative slope shows that the two variables are dependent.